3. myVCF features
myVCF is designed as a tool for browsing and visualizing mutational data coming from NGS technologies, including Whole-Exome and -Genome sequencing as well as target resequencing.
Several features have been implemented to help the end-user in the navigation and the exploration of his project. In the next paragraphs you will find the description of principal features available in myVCF.
3.1. How to query a project database?
The search engine in myVCF is very versatile. Once you are in a project homepage, you can query the database by searching for:
- Gene name (Official Gene Symbol)
- Genomic region (1:20000-200100)
- dbSNP ID (rs324239)
- Variant (1-456783-456783-A-T)
3.1.1. Gene/Region view
Basic gene/region search will generate a Gene page composed by:
- Table containing the mutations found in the gene/region
- Mutation plot showing the distribution of the mutations grouped by their functional consequence.
Here we described a simple gene search example
3.1.1.1. Example for SAMD11 gene search:
- Launch myVCF application (see how to launch here)
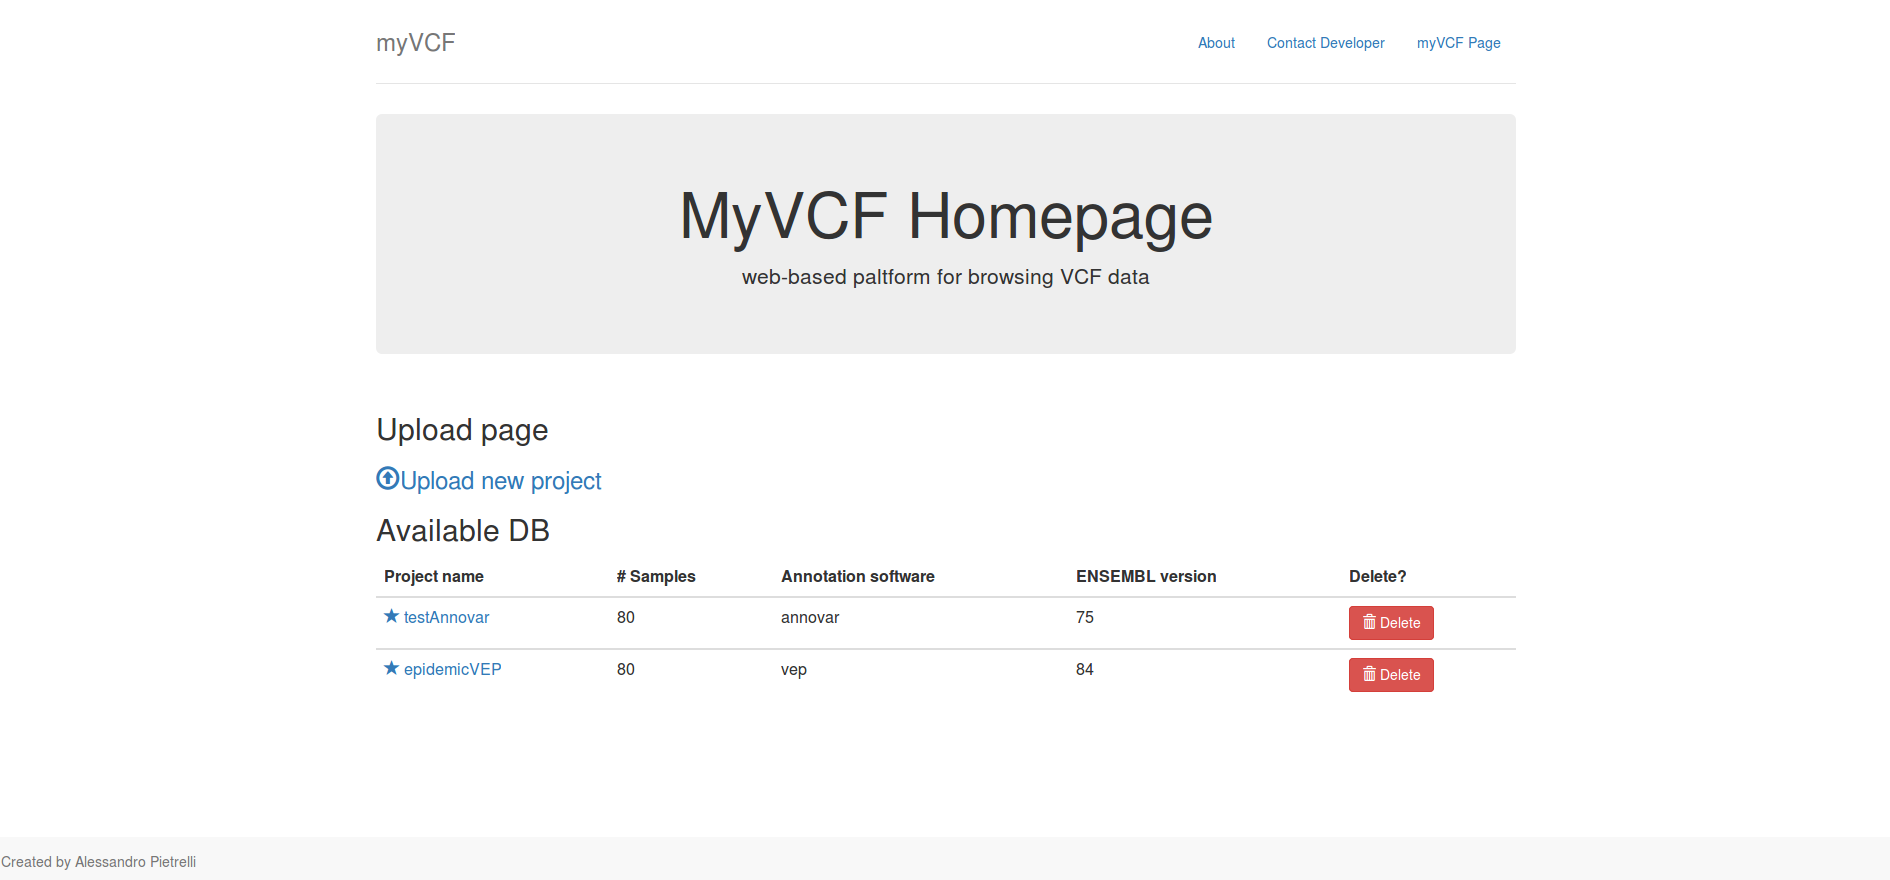
- Click on the project name you want to explore
- Fill the text box with
SAMD11and click GO!
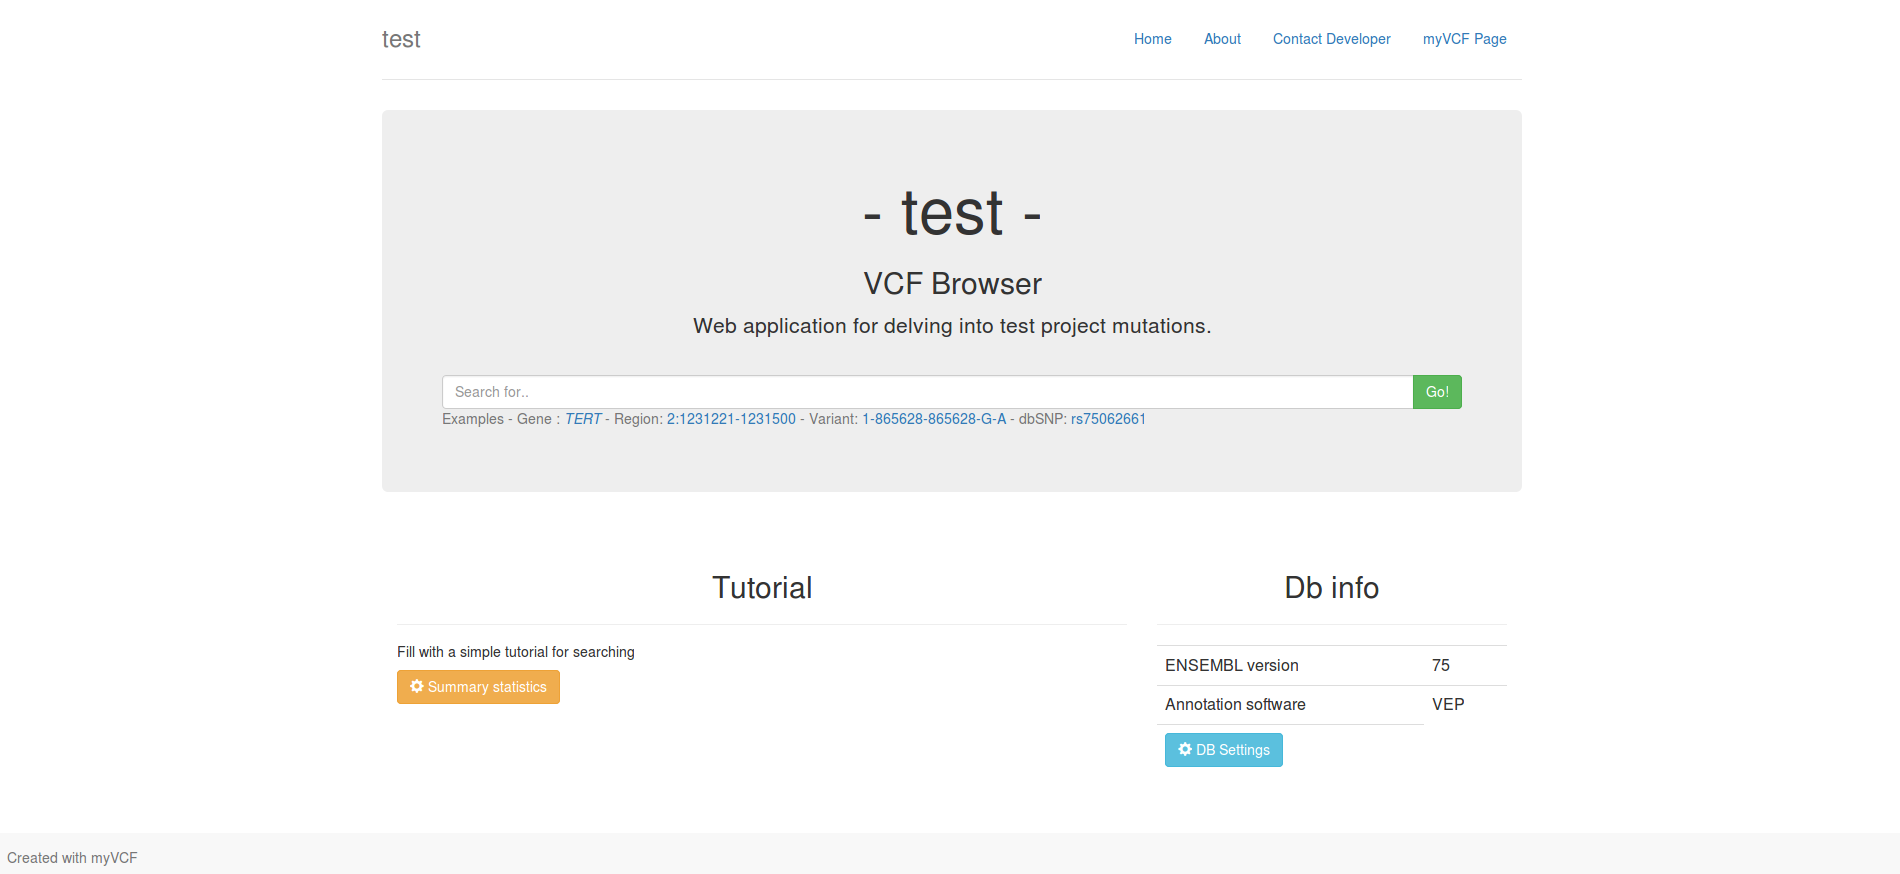
We searched for SAMD11 gene. The system will output all genes containing the name you searched for. So in this case, togheter with SAMD11, the pseudogene SAMD11P1 is also reported.
- To display the mutation list for
SAMD11 - ENSG00000187634just click on the ENSEMBL Gene ID link and you will be directed to the SAMD11 gene page
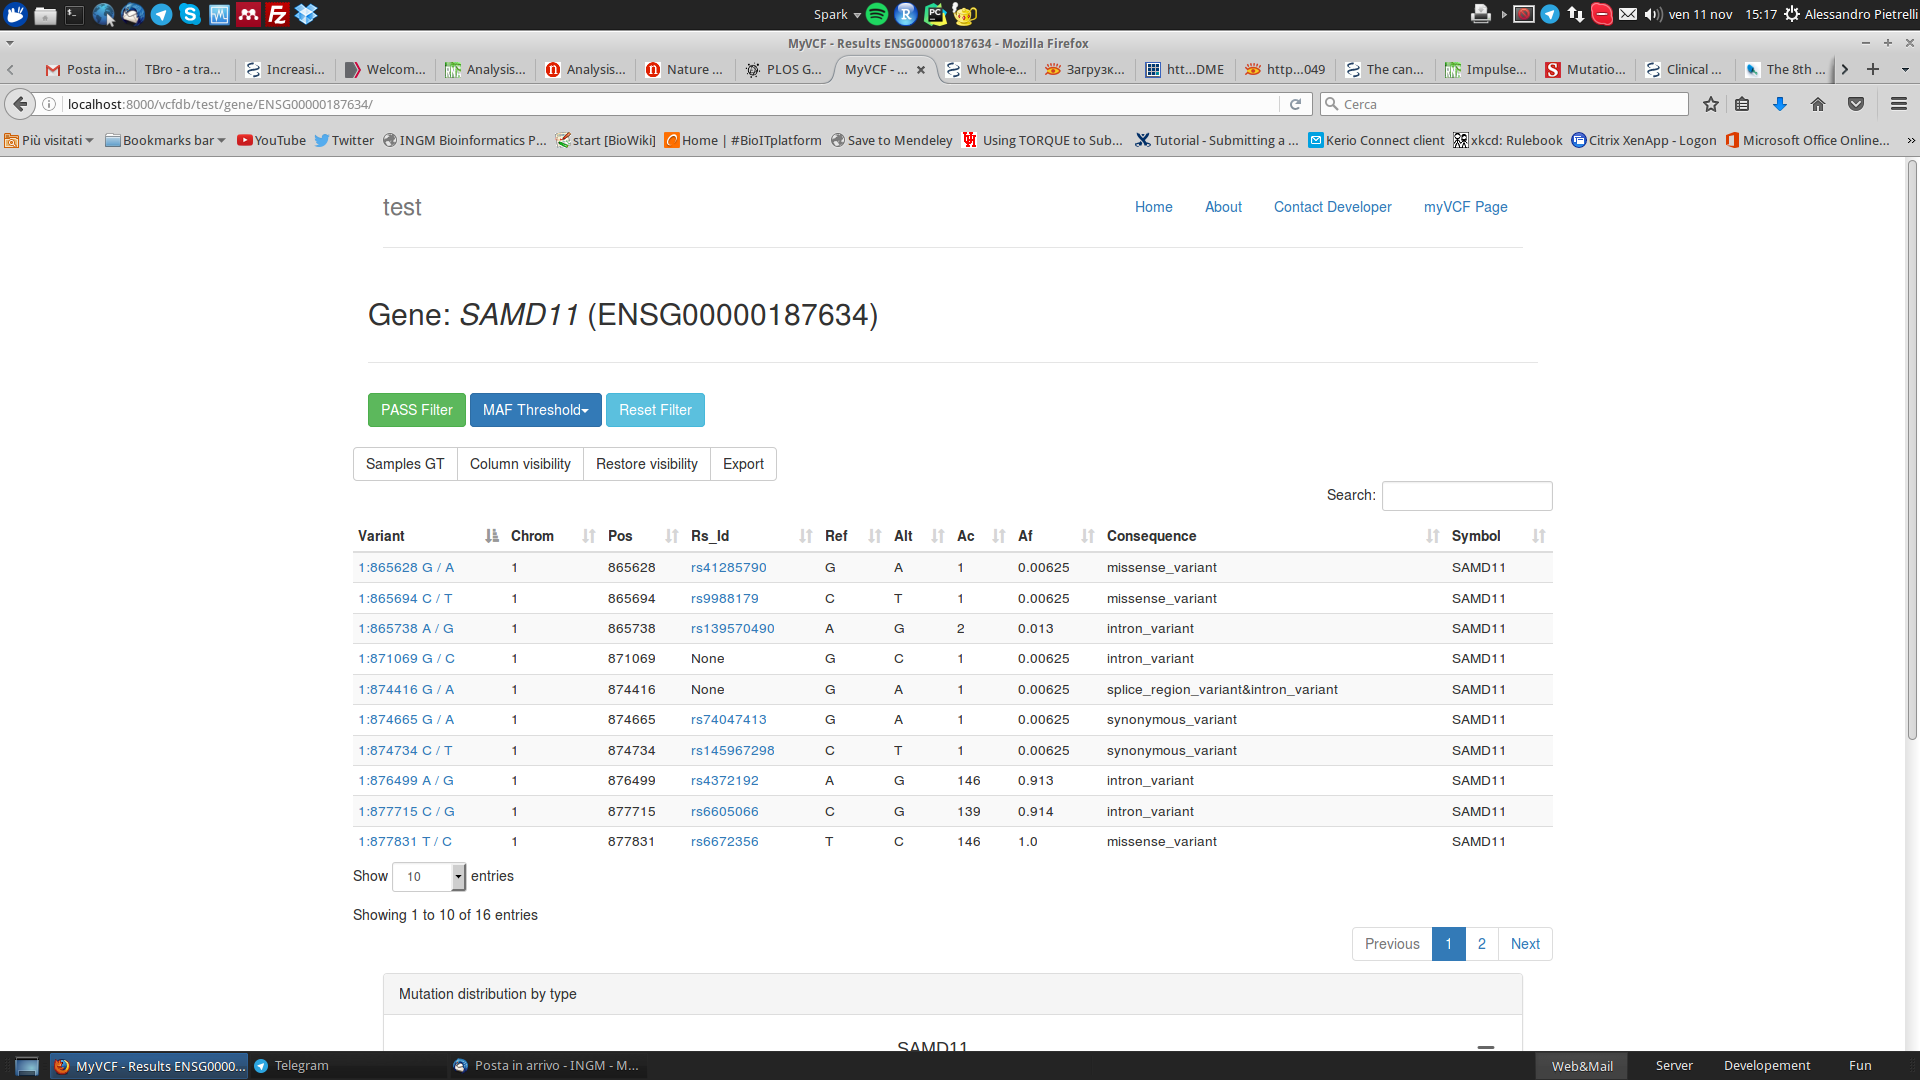
You can filter the mutations by using the Filter buttons 
- PASS Filter - Only PASS mutations will be showed. This filter acts on the
FILTERfield in the VCF file - MAF Threshold - Only mutations with an Allele Frequency (AF) lower than the MAF threshold you have selected will be reported. This filter acts on the
AFfield in the VCF file. - Reset Filters - Reset all filters. All mutations will be displayed.
You can also modify the visualization aspect by using the following Display buttons 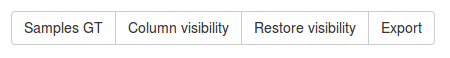
Samples GT - All the genotypes of the semples (stored in the VCF file) will be showed in the table
Column visibility - Toggle On/Off the columns by selecting them from a dropdown menu
Restore visibility - Restore the default column visualization
Export - Save the table in different formats including
XLS,PDFandCSVHint
The function to export the table will recapitulate the browser visualization. If the Sample genotype columns are showed in the table, they will be exported in the file.
Note
This visualization (Gene view) and all the entire features described in this paragraph are available to search for Gene (as in the example), Region and dbSNP ID
3.1.2. Variant view
Variant view directly connectes the single variant with the additional information contained in the VCF file uploaded and stored in myVCF database.
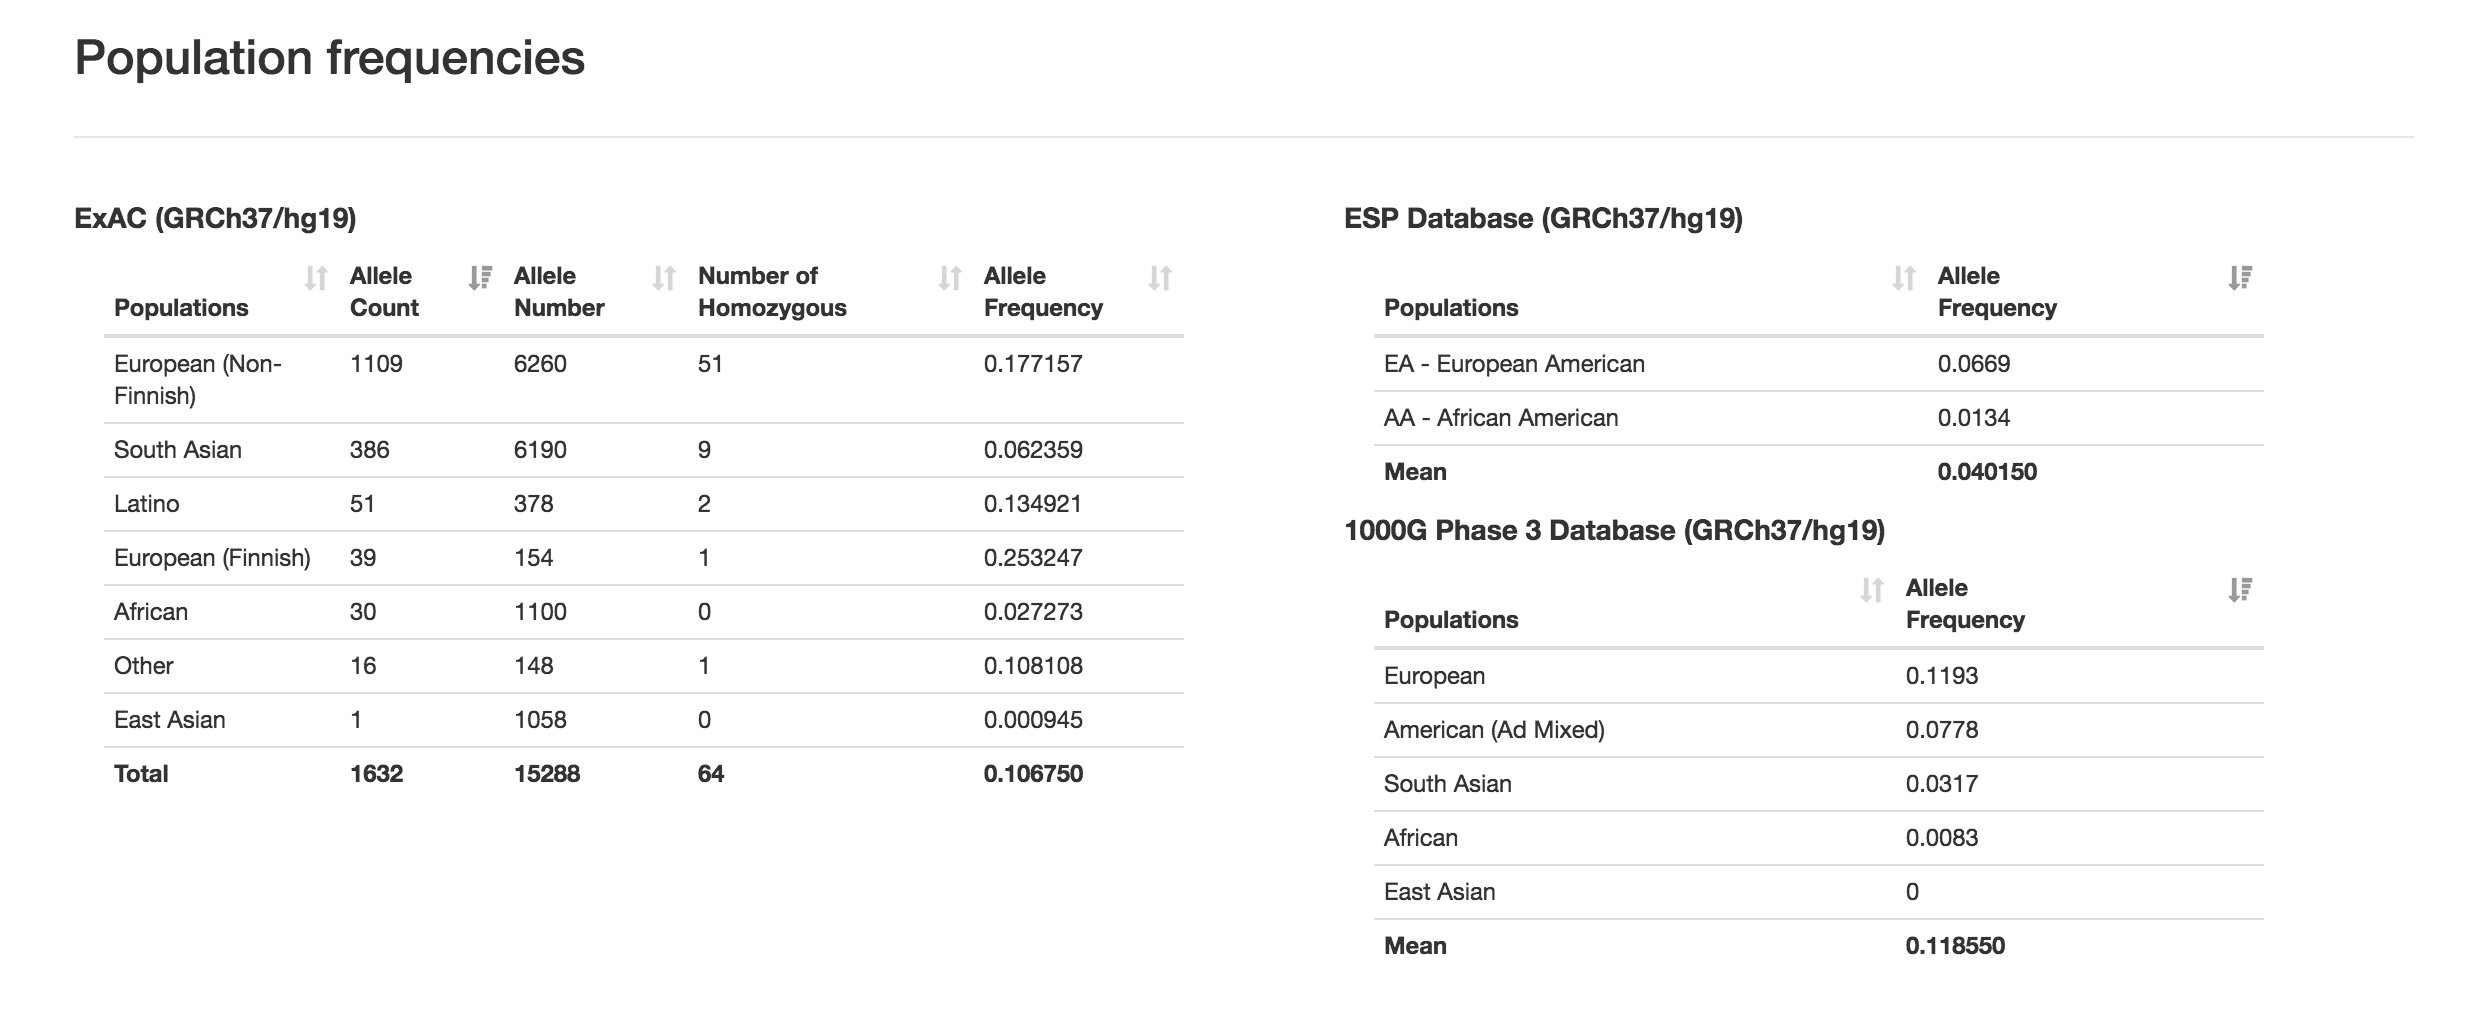
The variant page links additional information about the allele frequency of the searched variation by interrogating all the principal population frequency database:
- ExAC
- ESP
- 1000Genomes
Data from those database will be automatically displayed in the page.
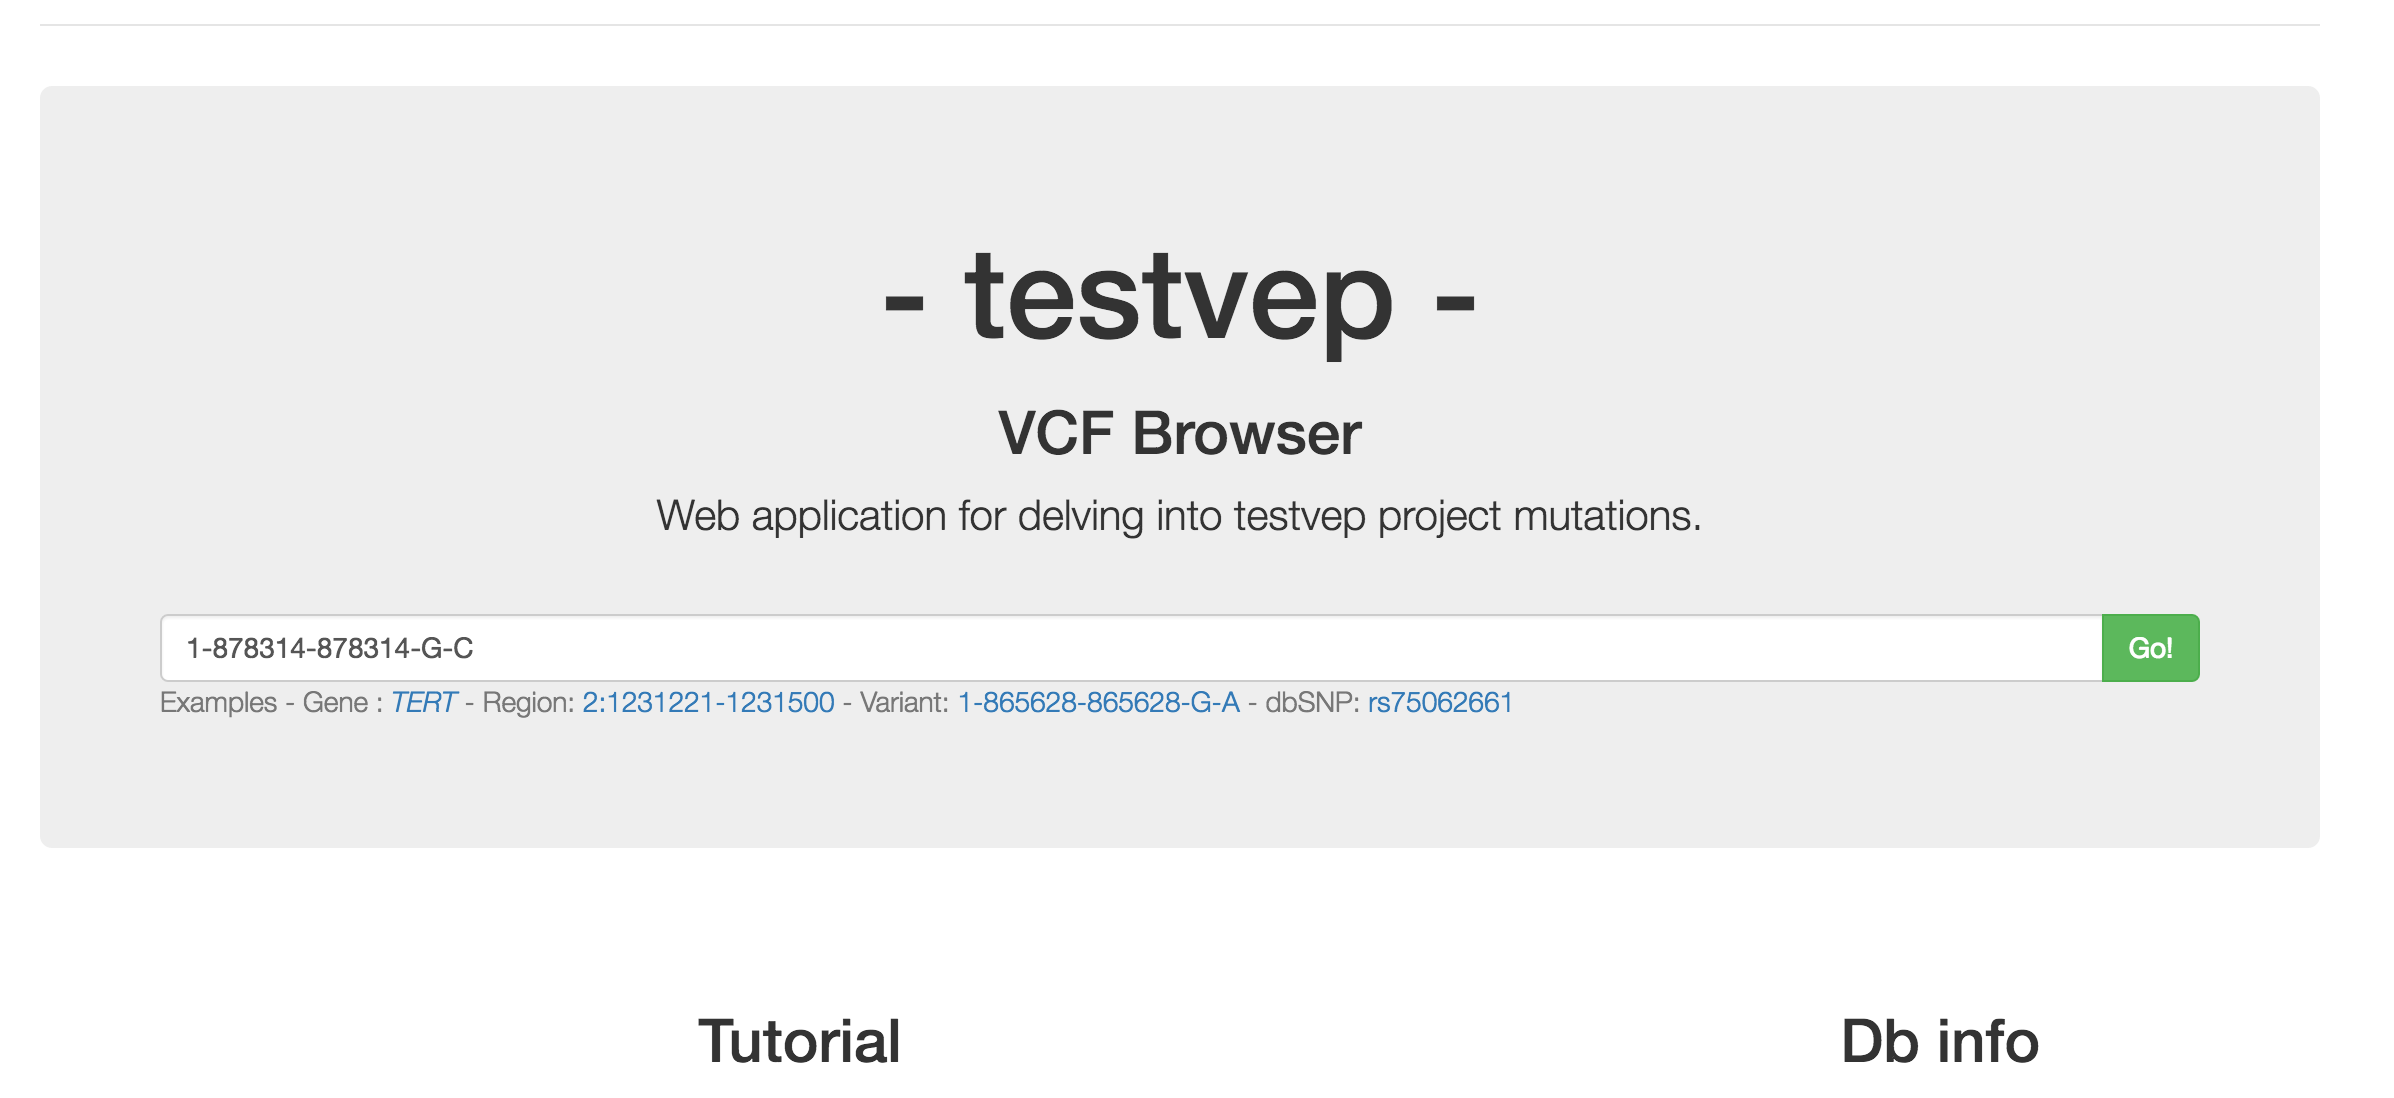
3.1.2.1. Example for variant search:
You can search directely for single variant by using the format:
CHR-Position-Position-Ref-Alt
from the project home page.
In this example we are going to search for the 1-878314-878314-G-C variant.
- If the variant exists in the VCF file, the variant page will retireve information from the VCF regarding:
- Variant quality
- Variant annotation
- Zigosity distribution across samples
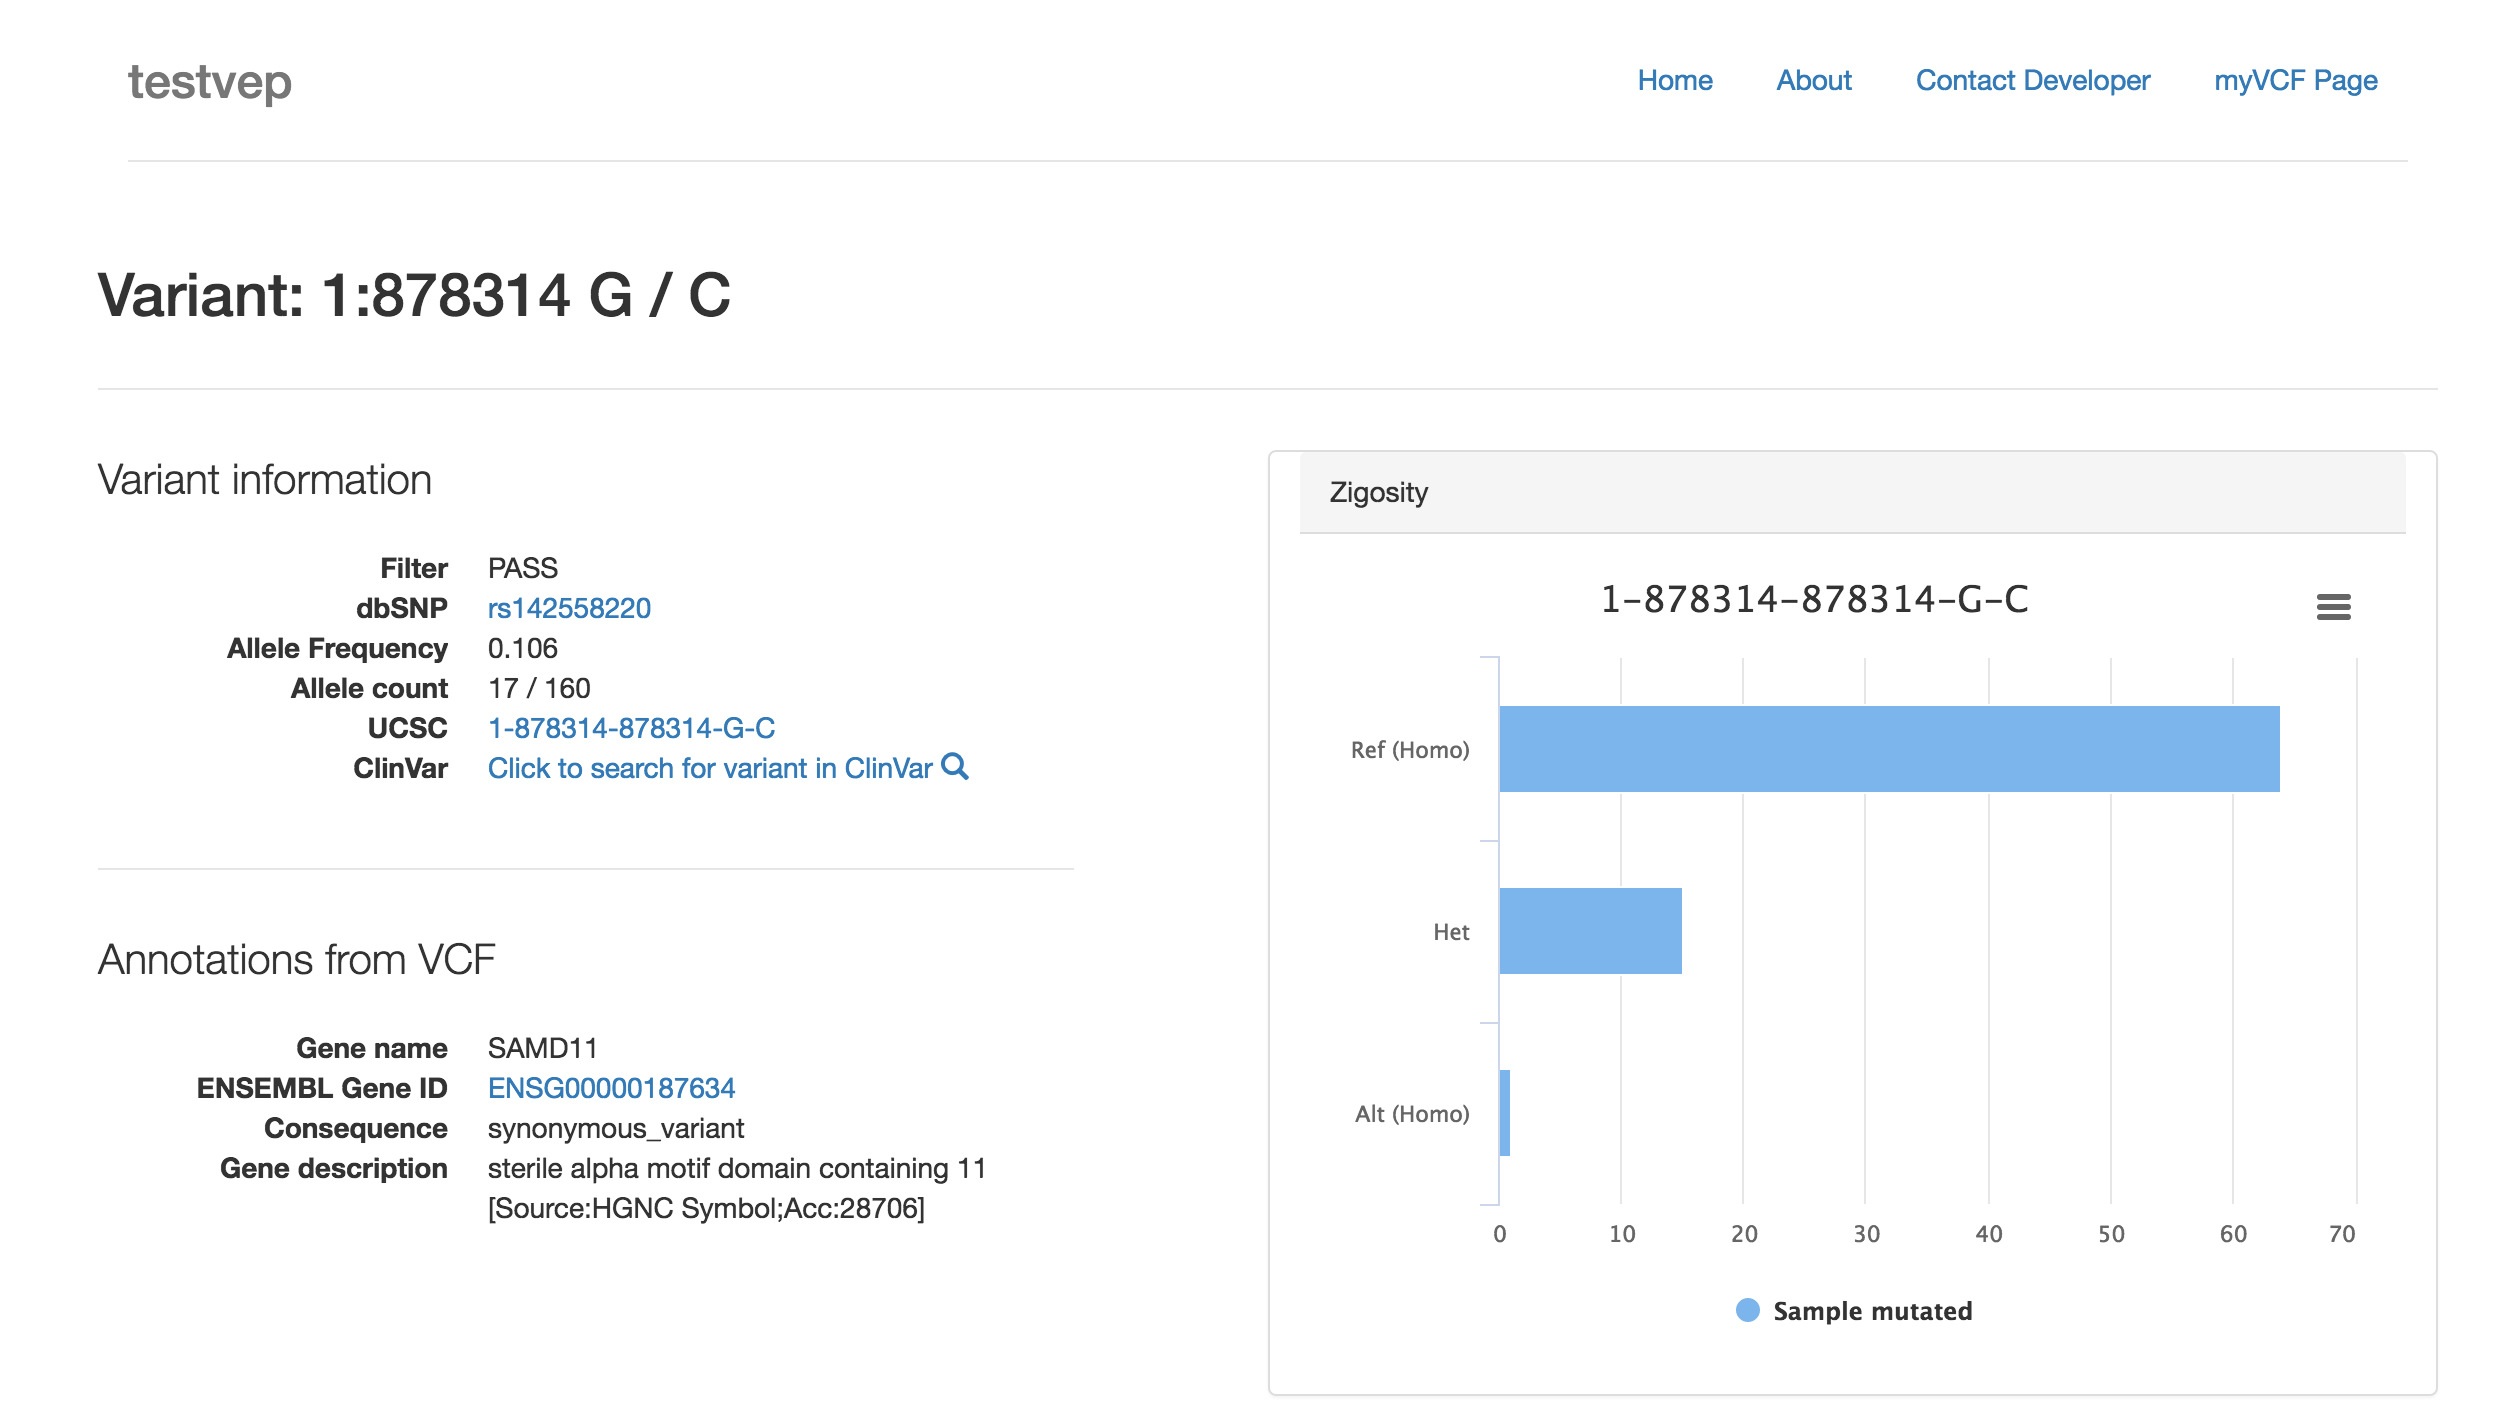
- In the bottom part of the variant page, you will find the variant frequency distribution according to major public databases.
Important
Since all the linked public database are mapped on GRCh37/hg19 human assembly, if you load and query variation from GRCh38 assembly the frequency showed won’t be correct!
Hint
Every variation in the gene table view (described before) is a link to its variant page.
Note
Internet connection is needed to retrieve the frequency information from public databases.
3.2. VCF metrics summary
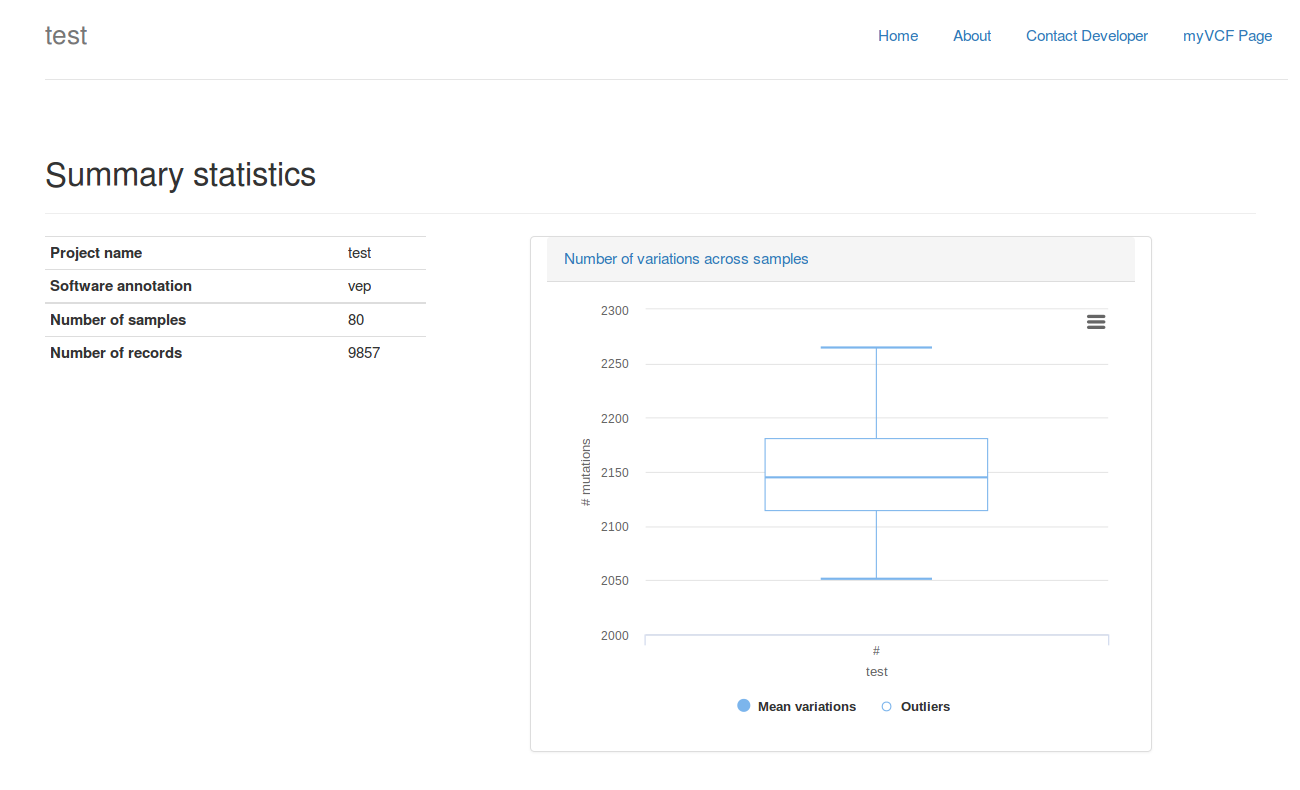
myVCF can also generate a global VCF summary report considering several metrics and information.
You can generate this report by clicking on the Summary button 
Hint
The first time you load the summary statistics the process will take several minutes, especially for exome/genome projects. All following loadings will be very fast thanks to the system saving in the cache that speeds-up the process. Cache memory will be removed once the application is closed.
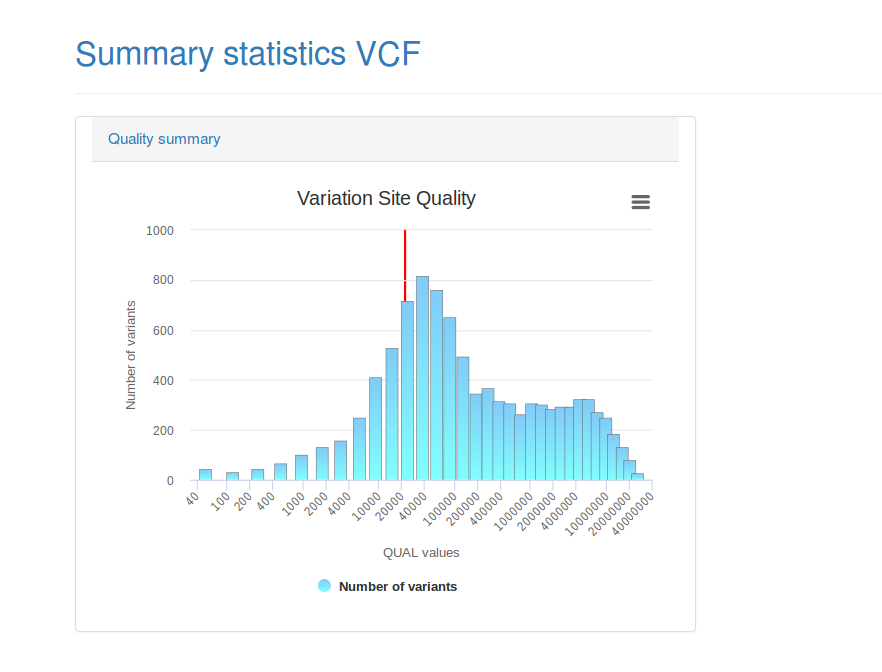
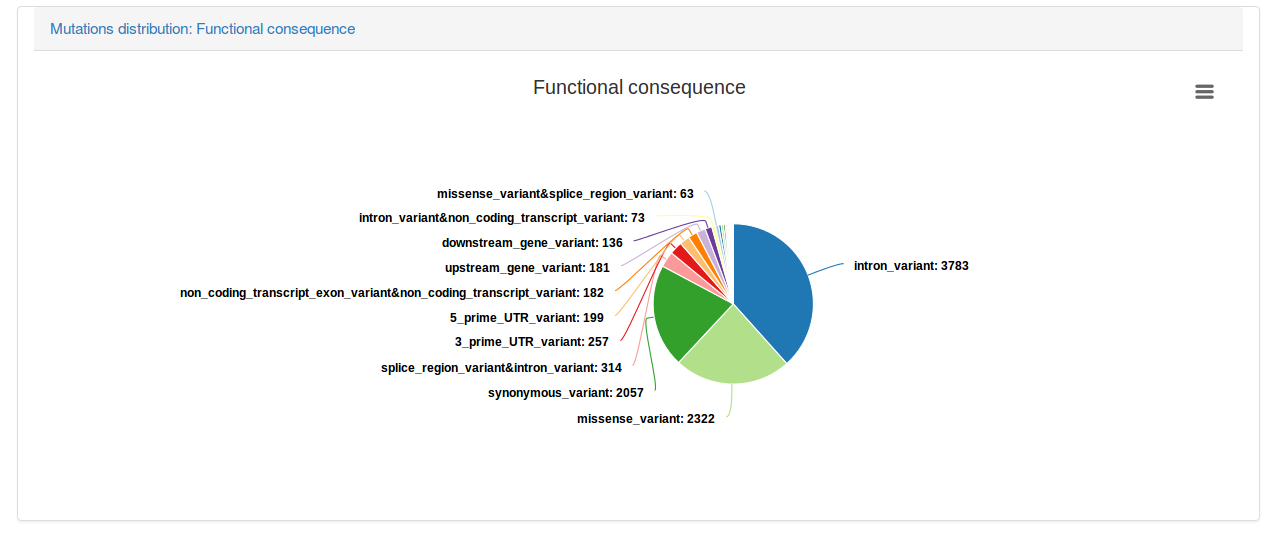
The VCF quality report consists of several statistics and plots all-in-one page. You can export separately each plot as single images.
Here, some example of the statistics generated:
- Number of variants and the distribution of mutation across samples
- Variant quality distribution
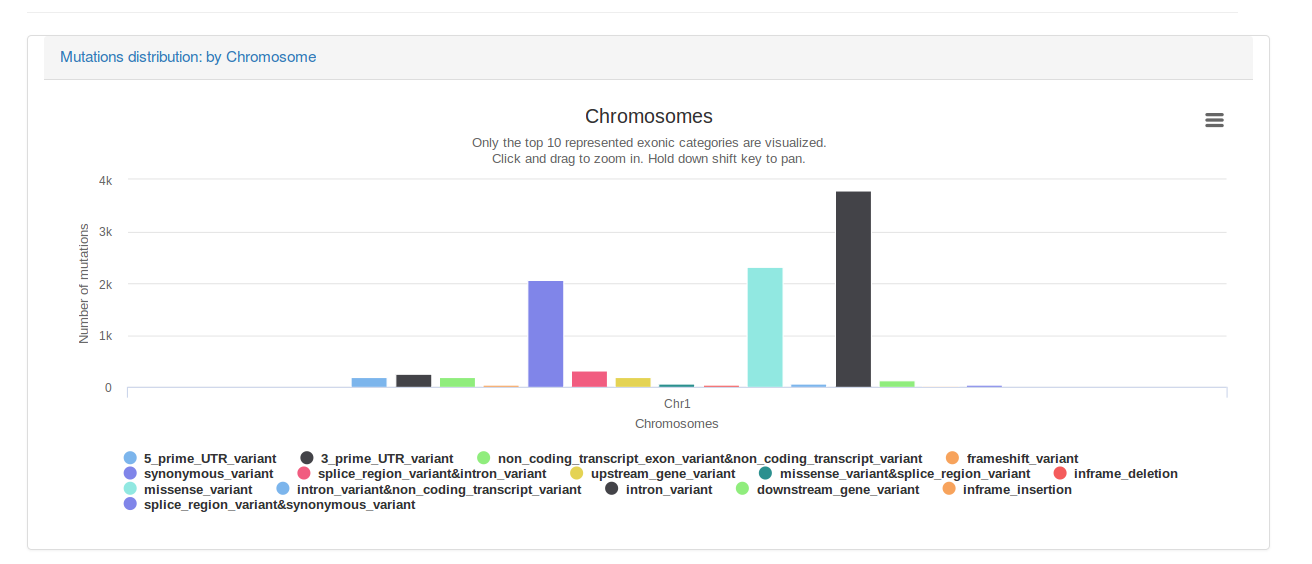
- Variant distribution across chromosomes stratified by functional consequence
- Variant functional consequence distribution as pie chart
3.3. Add sample groups
Most of the times, exome and target sequencing projects, are performed to understand the genetic difference between two or more group of samples that belong to a particular phenotype or hold some features of interest according to clinical data.
With myVCF you can easily define samples groups in order to filter and export mutations that are present only in certain samples defined by the group.
Hint
This feature is available only for human-based and annotated projects
To define and add groups in specific project, follow these steps:
- Click on DB settings page from the project homepage
- Go to Setup Groups section
- Define a group name and select the sample ID that you want to include in the group
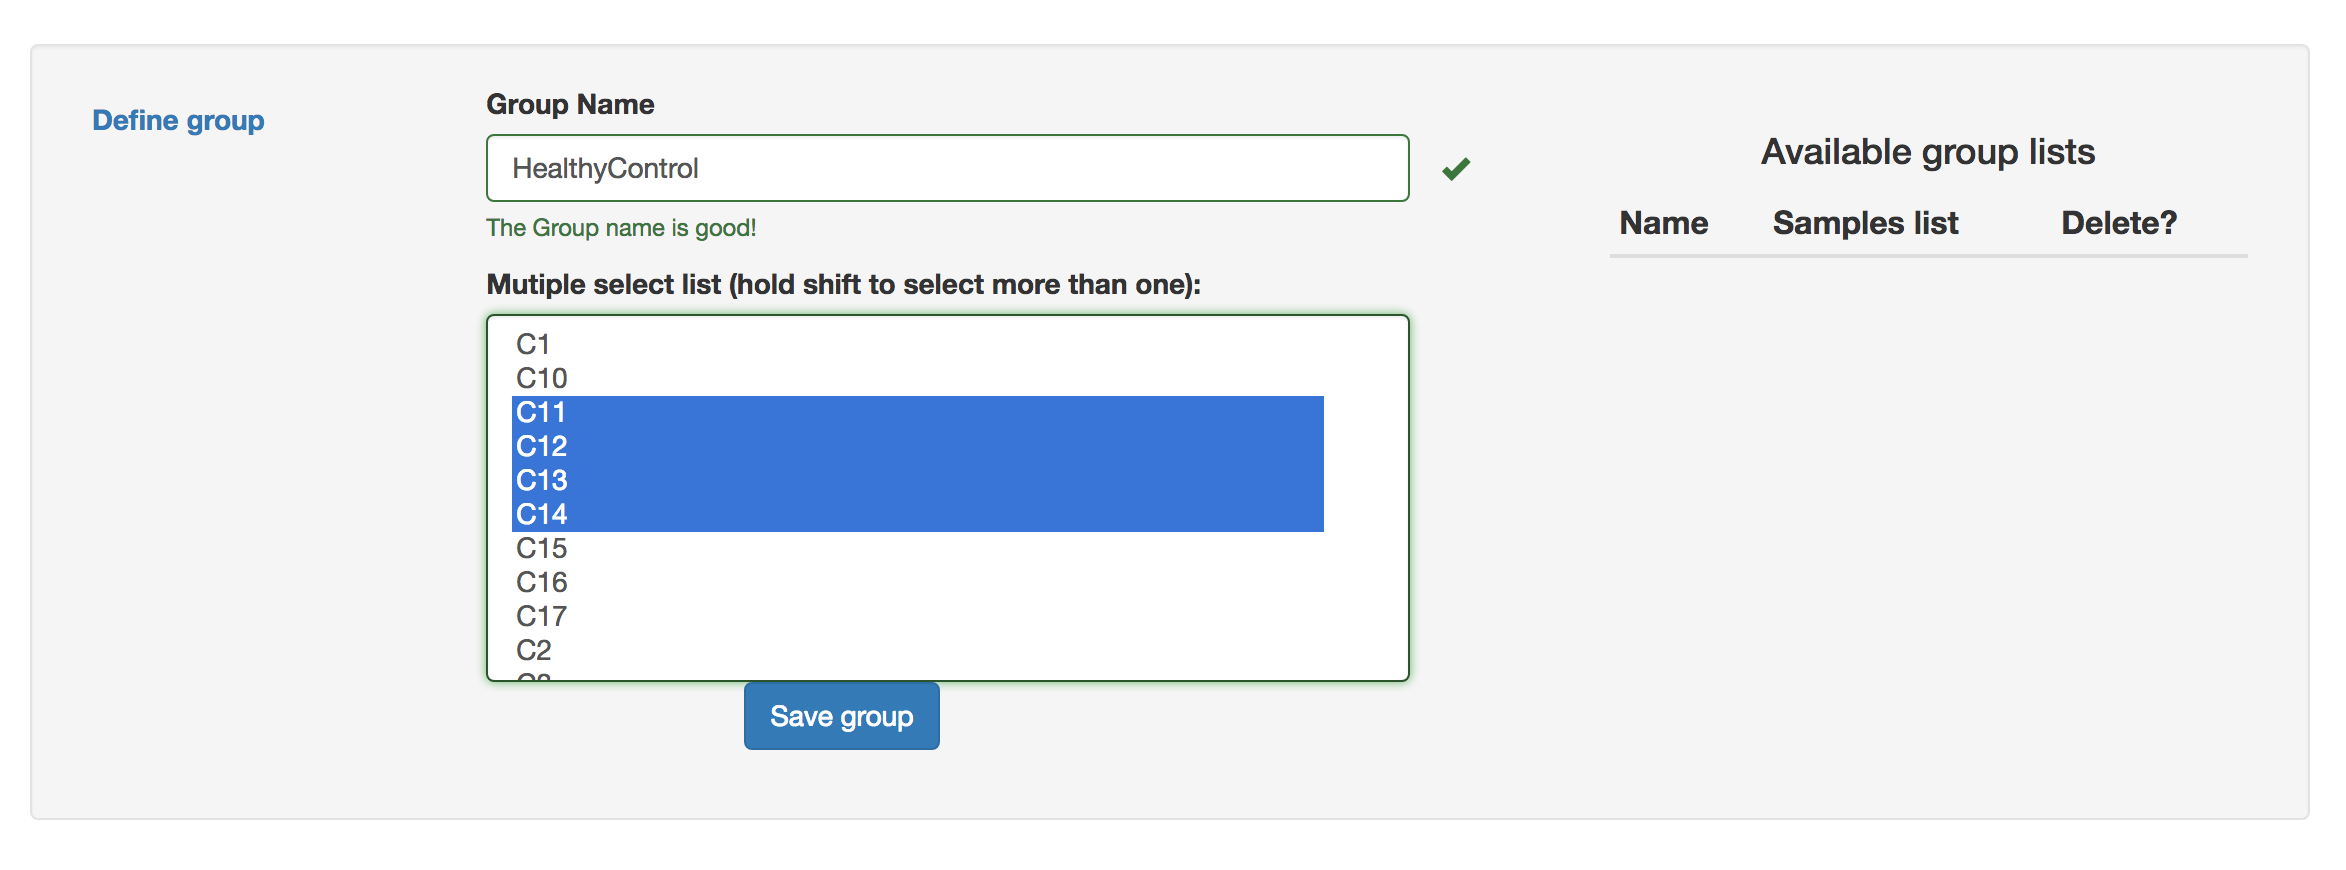
- Save group by clicking on Save group button
- You can verify the correct group definition by looking at the Available group lists table.
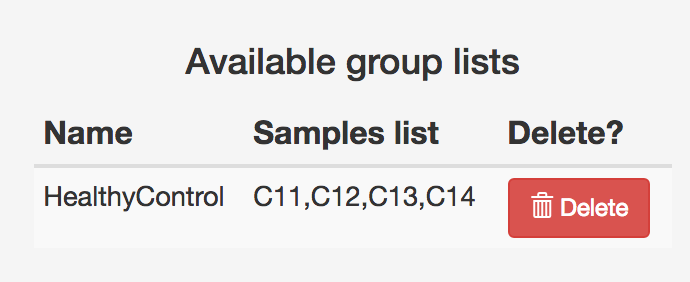
Now you can apply filters on mutations/region results by your sample group definition.
3.4. Change default columns view
By default myVCF visualizes a set of columns in the gene/region view composed by the principal annotation given by the VCF file.
You can change the default view by accessing to the DB settings page 
You will be redirected to the preferences page and you can select which columns will be displayed in the Gene/Region table.
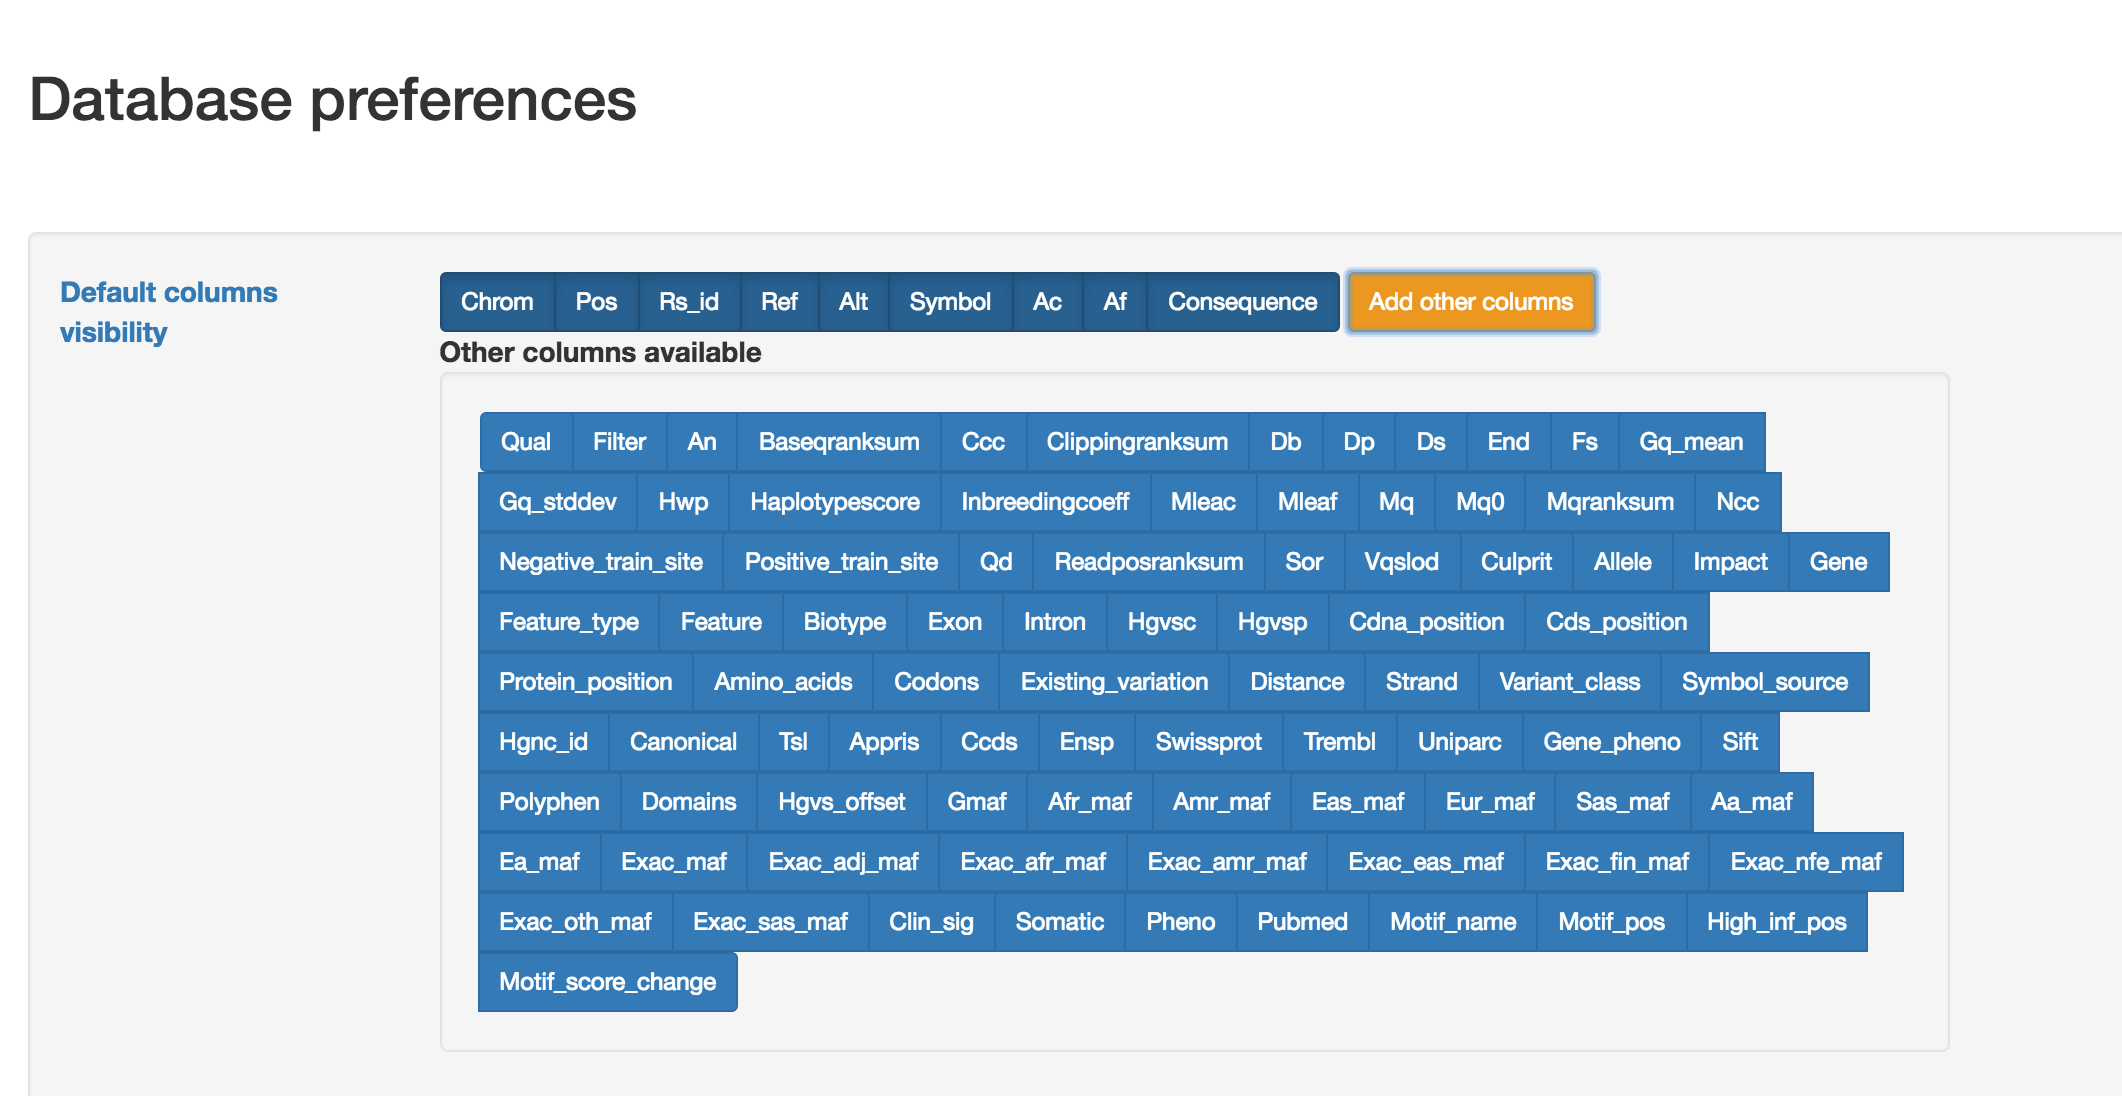
To save the column view modified by the user, click on Save changes